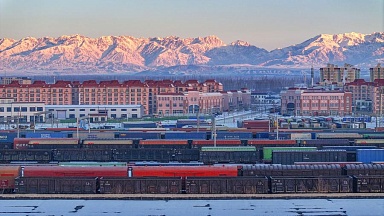
In the first half of 2026, the infrastructure of JSC «RZD» handled 3.9 million TEU (loaded and empty) across all traffic modes, representing a 3.7% increase compared to the 6‑month period of 2025. Of this total, domestic traffic (internal carriage) accounted for 1.5 million TEU, down 2.0% year‑on‑year; export traffic amounted to 0.88 million TEU, a decrease of 1.9%; import traffic reached 0.99 million TEU, an increase of 20.7%; and transit traffic totaled 0.58 million TEU, up 3.1%.
Container transportation (loaded + empty) on the RZD network by traffic type for the 6 months of 2026 compared to the 6 months of 2025, million TEU

Consequently, the overall growth in container traffic is attributable to increases in both import and transit flows.
When measured by the weight of cargo carried in containers, rather than by container volume, total containerized cargo transported during the 6 months of 2026 amounted to 40.8 million tonnes, a 1.7% gain over the corresponding figure for the previous year.
Loaded container movements across all traffic modes for the 6 months of 2026 rose by 5.9% year‑on‑year, reaching 2.8 million TEU.
By specific cargo types, container loadings (in TEU) were distributed as follows: chemicals and soda — 431.3 thousand TEU (+6.4% year‑on‑year); hardware/metal goods — 251.2 thousand TEU (+19.2%); timber/forestry cargoes — 247.1 thousand TEU (−17.8%); consumer manufactured goods — 251.2 thousand TEU (+27.0%); chemical and mineral fertilizers — 206.6 thousand TEU (−9.5%); automobiles and components — 204.9 thousand TEU (a 1.4‑fold increase); machinery, machine tools, and engines — 199.0 thousand TEU (+19.1%); paper — 184.6 thousand TEU (−3.8%); ferrous metals — 113.1 thousand TEU (+5.1%); non‑ferrous metals — 89.9 thousand TEU (+10.7%); construction materials — 78.4 thousand TEU (−12.8%); grain — 92.0 thousand TEU (a 1.4‑fold increase); and other/miscellaneous cargoes — 100.6 thousand TEU (+3.5%).
Containerized carriage of selected cargoes on the RZD network (all traffic modes) for the 6‑month periods of 2025 and 2026, thousand TEU

Selected Operational Performance Indicators of Rail Transport
Among the qualitative performance metrics of railway operations, the most critical group comprises the rolling stock utilization indicators, which characterize the use of rolling stock over time—such as the wagon turnaround cycle and its constituent elements, various speed categories, etc.
The wagon turnaround time represents the duration required for a wagon to complete a single work cycle, encompassing all operations related to the transport process (e.g., from the commencement of one loading operation to the start of the next).
The turnaround time for a freight wagon in the active fleet, based on the results of the first 6 months of 2026, amounted to 20.0 days (502.4 hours), which is 5.8% (or 30.7 hours, equivalent to 1.3 days) lower than the corresponding indicator for the same period of the previous year (22.2 days or 533.1 hours).
A breakdown of the wagon turnaround time by its constituent elements reveals that of the four components, two showed deterioration—time in transit (running time) and time at intermediate stations—with increases of 2.3% and 3.7%, respectively (their respective shares in the turnaround structure rose by 1.2 percentage points and 0.2 percentage points).
Conversely, the other two elements—time under cargo operations (loading/unloading) and time at technical stations—demonstrated improvements, decreasing by 5.3% and 11.0%, respectively (corresponding to reductions of 15.0 hours and 19.9 hours).
Based on the results of the 6 months of 2026, the average section speed of a freight train was 38.2 km/h, which is 1.8% lower than the analogous indicator for the 6‑month period of 2025 (38.9 km/h). The average technical speed of a freight train for the 6 months of 2026 stood at 42.5 km/h, a 1.6% decline compared to the same period of 2025 (43.2 km/h).