The Independent Regulators’ Group-Rail was established by 15 European rail regulatory bodies in June 2011, and now includes members from 31 countries. The report was released by the IRG-Rail Market Monitoring Working group, which was set up as a platform to collect and analyze railway related data.
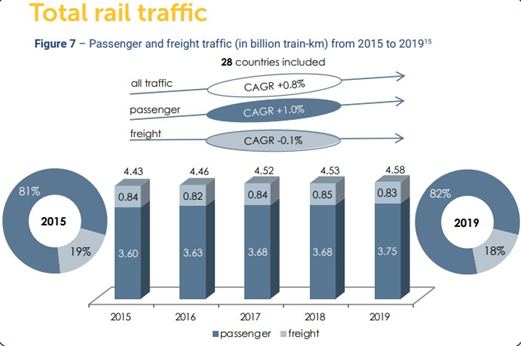
A total of 4.58 billion train-km was reported by 28 countries in 2019. Of this, passenger services accounted for 82% of total rail traffic while freight traffic contributed 18%, meaning a relatively low number of operators active in passenger services are responsible for the vast majority of total rail traffic.
The modal share of rail freight transport in the European Union, measured in tonne-km, was 18.7% of total inland freight transport in 2018. The total train-km performed by freight rail services was 830 million in 2019, down −0.1% over the past five years. However, freight demand, measured in tonne-km performed, increased by 1.3% per year on average between 2015 and 2019 to 455 billion net tonne-km. The ratio of net tonne-km over freight train-km has risen by 5.8% since 2015.

Although the share of domestic incumbents, based on net freight tonne-km, continues to decrease, it still remains predominant. The share of new market entrants increased by 3% in 2019 to 48% of national markets on average. The growth was driven primarily by non-incumbent operators, who increased their market share from 32% in 2018 to 35% in 2019.
From 2015 to 2019, revenues per train-km remained relatively stable with an annual average growth rate of 0.8% and a total increase of 3.3%. In the same period, revenues per tonne-km dropped by 0.4% on an annual average, slowed by a 2.9% increase between 2018 and 2019.

In 2019, passenger operators recorded 3.7 billion train-km among 28 monitored countries, corresponding to 497 billion passenger-km among 26 monitored countries.
From 2015 to 2019 the number of train-km has remained relatively constant, with an average annual increase of 1.0%. During the same period, the traffic in passenger-km has continuously increased in the monitored countries, with a 2.6% average annual growth rate between 2015 and 2019.
In 2019, there were on average 136 passengers per train, with a 1.6% average annual growth rate between 2015 and 2019. The average revenue for passenger operators was €20.93 per train-km and €0.1489 per passenger-km.
In 2019, incumbents still had by far the biggest market share of passenger rail services, with 75% of all passenger-km, compared with 8% for foreign incumbents and 15% for non-incumbents.
In 2019, the overall route length for IRG-Rail monitored countries was approximately 230,000km, with more than 50% in Germany, France, Poland, Italy and Britain. Luxembourg has the shortest network of all participating countries, at 271km.
Relative to country size, Switzerland has the highest network density with 12.82km of route per 100 km2, followed by the Czech Republic at 12.13km of route per 100km2. Norway has the lowest network density with just 1km of route per 100km2. Latvia, Estonia, Finland and Sweden have the densest networks in terms of route length per population with more than 10km of route per 10,000 inhabitants.

Across 29 countries, 56% of the total route length was electrified in 2019. Since 2015, the length of electrified route has been slowly increasing at a rate of 0.6% per annum. Conversely, the length of non-electrified route has declined at an average rate of 0.7% per year.
In 2019, the total amount of track access charges (TAC) paid by operators to infrastructure managers was €18.9bn, a 1% increase compared with 2018. Over the last five years, the average annual growth rate was 2.9%. TAC for passenger services represented 90% of the total, a share which has marginally increased compared to the previous years.
The average TAC per train-km for passenger services increased from €4.13 in 2015 to €4.63 in 2019, while the average TAC for freight services decreased from €2.84 to €2.31.
In 2019, 15 countries reported additional active operators, while 14 countries reported the same number of active operators on the network. Only Estonia reported a decline in the number of operators on its network. The number of operators varies from two in Finland, Kosovo and Luxembourg, up to 332 in Germany.
The full version of the report is available here.


