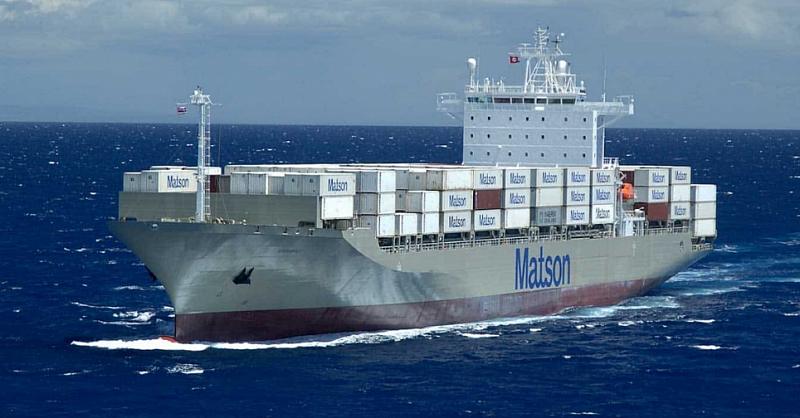
«We knew it was going to be good, but dadgum ...,» exclaimed Stifel analyst Ben Nolan upon seeing the preliminary third-quarter 2020 results from Matson (NYSE: MATX).
Matson’s disclosures offer the first signals of how solid Q3 2020 earnings will be for container lines across the board. Container-line profits exceeded expectations in Q2 2020, a period when volumes were weak. In the third quarter, volumes and rates surged — and not just in the trans-Pacific trade.
«The stars are aligning for container shipping: historic consolidation, rational capacity management and now a fast bounce-back in demand post-lockdown,» wrote Jefferies analyst David Kerstens.
Upside surprise
Matson is primarily in the Hawaii and Alaska Jones Act trades, but also runs China-U.S. services called CLX and CLX+. After market close on Thursday, Matson said it expected Q3 2020 earnings of $1.55-$1.60 per share, far exceeding the Wall Street consensus for 96 cents. Expected ocean transport operating income of $84.5 million-$86.5 million is double last year’s number.
Matson’s China volumes spiked 125% year-on-year, which the company attributed to a shift from air freight to premium ocean service, e-commerce demand and tight U.S. inventories.
«While rates may not be able to hold their current levels ... volumes remain very high. Thus, we are expecting continued strength in the fourth quarter,» said Nolan.
Matson’s shares jumped 15% on Friday. The stock price has doubled since mid-May.
On Monday, Maersk — the world’s largest container-line owner — updated its guidance. It reported that Q3 2020 earnings before interest, tax, depreciation and amortization (EBITDA) will be $2.4 billion excluding restructuring charges, 20% above the consensus estimate. Maersk hiked its full-year 2020 EBITDA guidance from $6 billion-$7 billion to $7.5 billion-$8 billion. The midpoint of the new range is 12% above the consensus estimate of $6.9 billion.
Exposure to trans-Pacific upside
Matson’s exposure to the trans-Pacific route was around 5,800 twenty-foot equivalent units (TEUs) per week in Q3 2020. This pales in comparison to the larger carriers like Maersk.
Alphaliner analyzed the top carriers’ capacity on the trans-Pacific route as of Sept. 30. It found that the COSCO Group ranked highest in terms of volume, with an average weekly capacity of 89,050 TEUs. The group includes COSCO Shipping and OOCL, both listed in Hong Kong.
France’s CMA CGM — which has publicly traded U.S.-dollar-denominated bonds — came in second, with 74,200 TEUs.
Japan’s ONE took third with 61,200 TEUs. Maersk had the fourth-highest exposure, 59,000 TEUs per week.
Interestingly, when looking at the top 10 carriers in terms of volume, Israel’s ZIM, the company that ranked 10th, had the highest exposure as a percentage of total deployments. It deploys 52% of its global fleet in the trans-Pacific.
ZIM is planning an IPO and is in the midst of buying back outstanding bond debt, according to Alphaliner. «ZIM may not find a better time in the cycle to attempt an IPO,» said Alphaliner, which noted that ZIM failed at three previous IPO attempts in 2008, 2011 and 2016, respectively.
Q3 customs data: bullish
Inbound volumes to the U.S. West Coast were exceptionally strong in the third quarter. According to investment bank Jefferies, the upside from a historic inventory restocking phase has just begun.
FreightWaves’ SONAR platform features data collected from U.S. Customs on the number of maritime import shipment customs filings per day (regardless of volume), calculated as a seven-day moving average.
The countrywide data (SONAR: CSTM.USA) shows the number of filings exceeded levels seen in the past two years for about two-thirds of Q3 2020. In contrast, the number of customs filings in Q2 2020 exceeded the prior two years’ levels for only about a quarter of that reporting period.
Q3 rate data: even more bullish
Asia-West Coast spot rates remain near record highs, despite the recent Golden Week holiday in China.
The Freightos Baltic Daily Index assessed Thursday’s rate from China to the West Coast (SONAR: FBXD.CNAW) at $3,841 per forty-foot equivalent unit (FEU), very close to the high. The Shanghai Containerized Freight Index (SCFI) puts this week’s Shanghai-Los Angeles rate at $3,848 per FEU, essentially flat week-on-week (down 0.3%).
SeaIntelligence Consulting CEO Lars Jensen pointed out in an online post that if one takes normal Golden Week seasonality into account, «the spot market actually strengthened slightly.»
Looking at the third-quarter rates as a whole, the data shows that spot China-West Coast rates were roughly double Q2 2020 levels and almost triple rates in Q3 2019.
Furthermore, rate strength is not limited Asia-U.S. trade.
«The trans-Pacific is not the only trade that witnessed hefty rate increases,» said Alphaliner. «The evolution is even more spectacular between Shanghai and Santos [Brazil]. Unexpectedly high cargo demand has also pushed up spot rates on other North-South routes» including Shanghai to Durban, South Africa, and to Lagos, Nigeria, it added.
According to the SCFI, rates from Shanghai to Santos were $3,952 per TEU this week, seven times the rate in late August. Last week, Shanghai-Durban hit a record high of $1,737 per TEU and Shanghai-Lagos hit a record high of $3,293 per TEU. Click for more FreightWaves/American Shipper articles by Greg Miller


