Produced in conjunction with Infrastructure Economic Centre, a consultancy based in Moscow and Paris, Eurasian Corridors: Development Potential offers an analysis of major changes to the routes in the last few years, and suggests how traffic is likely to develop between now and 2030. It also analyses the elasticity of rail freight demand in relation to the level of subsidies from China and potential improvements to logistics processes, transit times and border crossings.

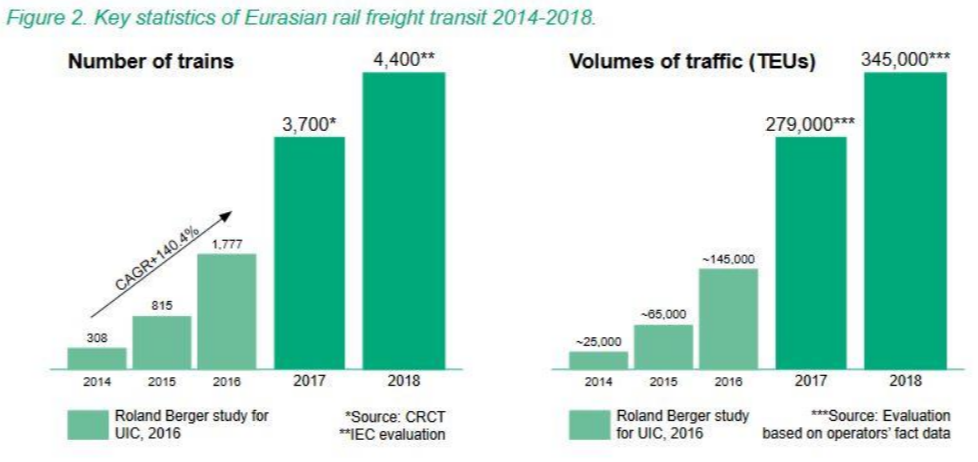
Growth in the Asia — Europe rail freight market slowed in 2018-19 compared to 2016-18, with ‘the dynamic changing from fast to moderate growth’. From 65 000 TEU in 2015, volume shot up to 145 000 TEU in 2016 and reached 279 000 TEU in the following year; the estimated figure for 2019 was 345 000. Westbound traffic dominated, with 56% travelling towards Europe in 2018 and 44% eastbound. In terms of loaded containers, 67∙6% were westbound, against just 32∙4% heading east.

‘About 95% of Euro-Asian transit in both directions goes via Russia’, the study found, although the Baku — Tbilisi — Kars route through Azerbaijan, Georgia and Turkey and its connection to the Trans-Caspian rail route had recently been added to shippers’ options.
Other notable changes included an accelerating trend towards automation and digitalisation ‘in all aspects of logistics’ and a move towards alliances and co-operation as players stepped up their marketing efforts, indicating that ‘the market is still developing and has not yet reached its final configuration’.
Forecasts
The study looked at three macroeconomic scenarios to assess the likely potential for traffic up to 2030. A pessimistic scenario embracing possible trade wars, a health crisis and geopolitical tensions was pitched against a ‘baseline’ option that assumed stable growth and an ‘optimistic’ one which postulated accelerated growth of major economies and further globalisation. Forecast traffic in 2030 ranged from a low of less than 450 000 TEU to more than 2 000 000 TEUs in the best case. The baseline figure was 872 000 TEU, and the modelling of demand elasticity was based around this.

According to the model, which assessed various ‘levers’ that could affect future growth, demand was more sensitive to price than speed. However, an increase in speed along the Trans-Siberian route and the launch of regular feeder services from South Korea and Japan were perceived as having a positive impact. Growth would also follow adoption by all parties of the CIM/SMGS consignment note which ensures legal interoperability by ‘materialising contracts’ and which is recognised as a customs transit and as a bank document.
The most detrimental factor for future growth would be a reduction in the level of subsidy provided by China for rail transits to Europe; port developments would also have a negative impact. Other factors that could affect future growth are the capacity of border crossings and the speed of border operations, but in both cases the impact would be limited.
‘Drastic impact’
Addressing the likely impact of subsidies from China being cut from 50% to 20%, the study found that this would be ‘a key stressing factor for the sustainability of Eurasian rail transit’. It would have ‘a drastic impact on flows and see a reallocation across the different corridors’, with ‘market reshape and emergence of new services’. Southern routes via Kazakhstan would be likely to be affected first, with volumes decreasing. ‘Most of the cargo currently transported relies heavily on subsidies’, the report explained. Exceptions would be time-sensitive goods or cargoes ‘requiring specific conditions of transportation’ such as foodstuffs, machinery products and chemicals.

A secondary effect would be the emergence of new opportunities for ‘market players on the northern routes’. Reduced price competitiveness with the deep-sea market could perhaps stimulate ‘niche and «high-tech» services, including e-services’. This would also apply in the case of unfavourable economic conditions as outlined in the pessimistic scenario. The report envisaged that co-operation projects among business and governmental stakeholders could also be stepped up.
A number of ways to mitigate the negative impacts are suggested, the best being ‘a co-ordinated joint work along ocean-to-ocean corridors, which can be an important part of international sustainable development policy’. This could ‘raise the overall competitiveness of rail transportation ... and help cope with the inequality of flows in different directions thanks to creation of a balanced network of logistics hubs combining transit flows with exports and imports’.


